El Nino 2026 is no longer a vague weather headline. It is a live ocean signal with a risk surface.
El Nino 2026 matters because El Nino is not just a warmer patch of water in the Pacific. El Nino is a planetary circulation shift that can change rainfall, heat, wildfire weather, crop stress, flood pressure, coastal erosion, infrastructure strain, and emergency planning. El Nino 2026 is especially worth watching because official 2026 outlooks show a fading La Nina, a neutral spring, and rising El Nino probability into summer, fall, and winter.
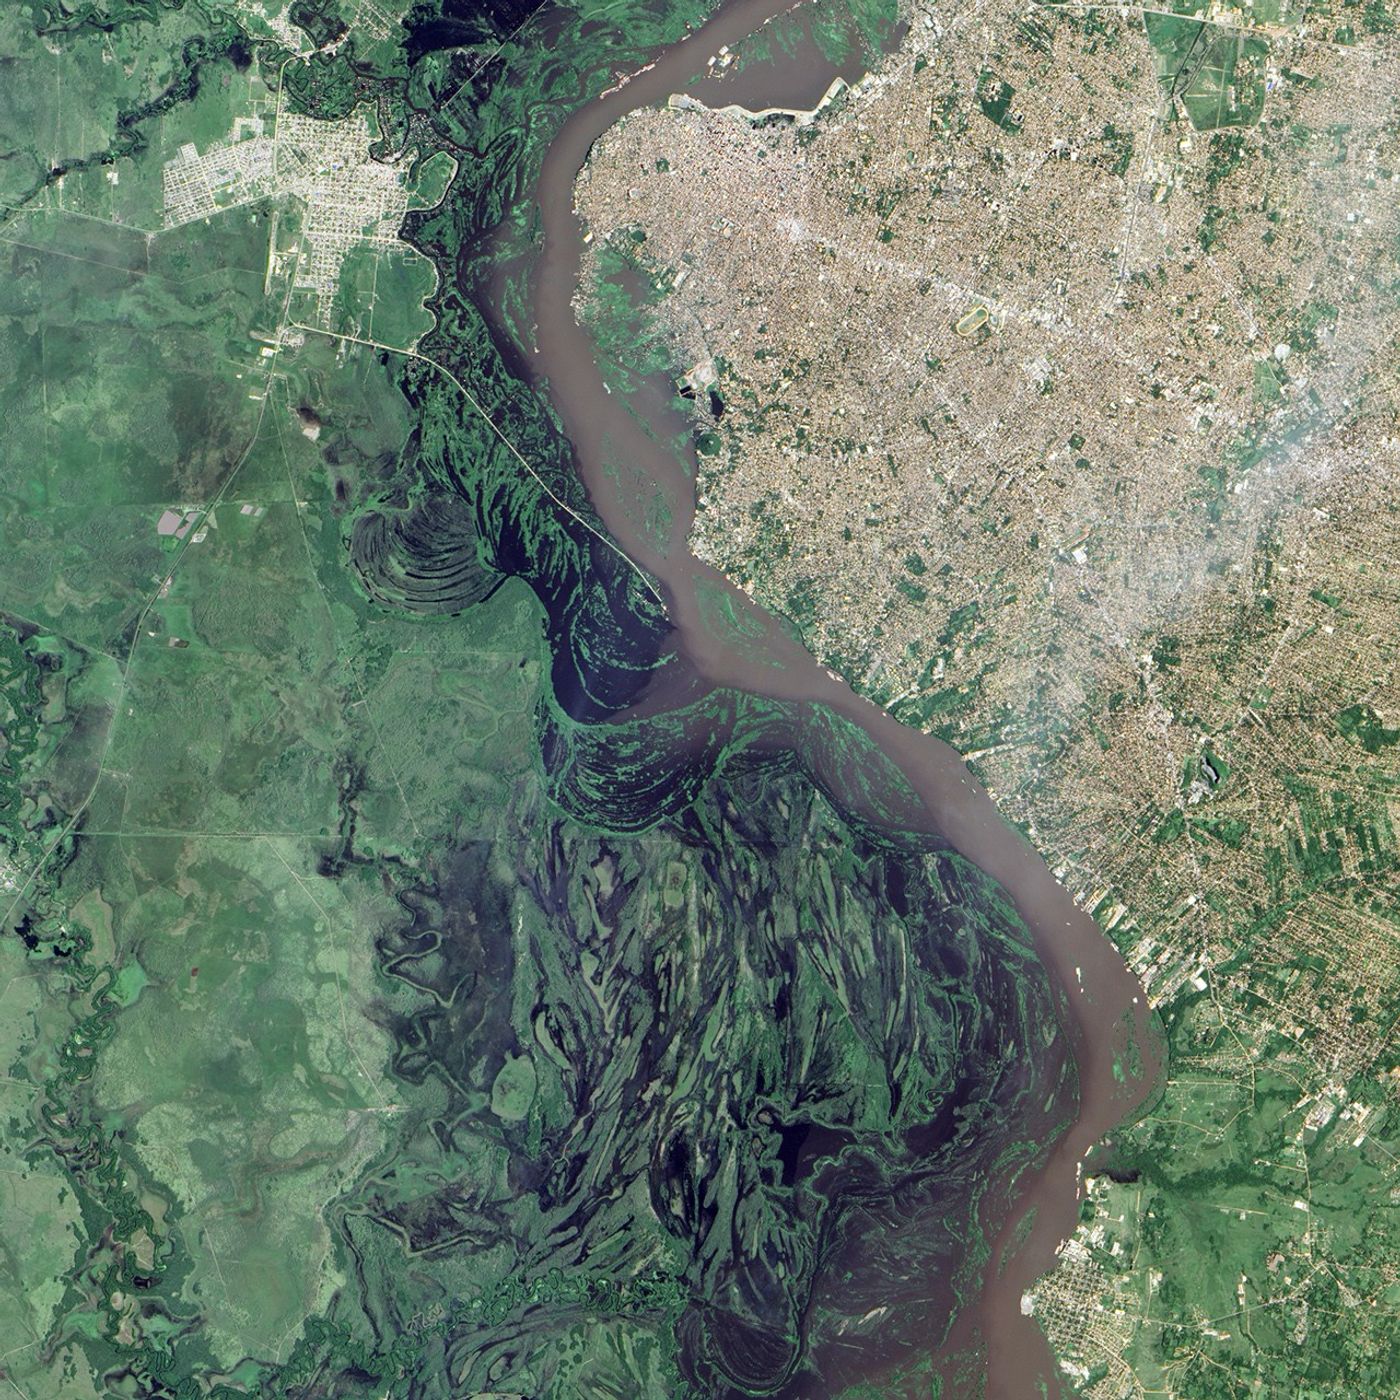
NASA imagery of flooding along the Paraguay River helps explain why El Nino 2026 monitoring should connect ocean signals to flood readiness.
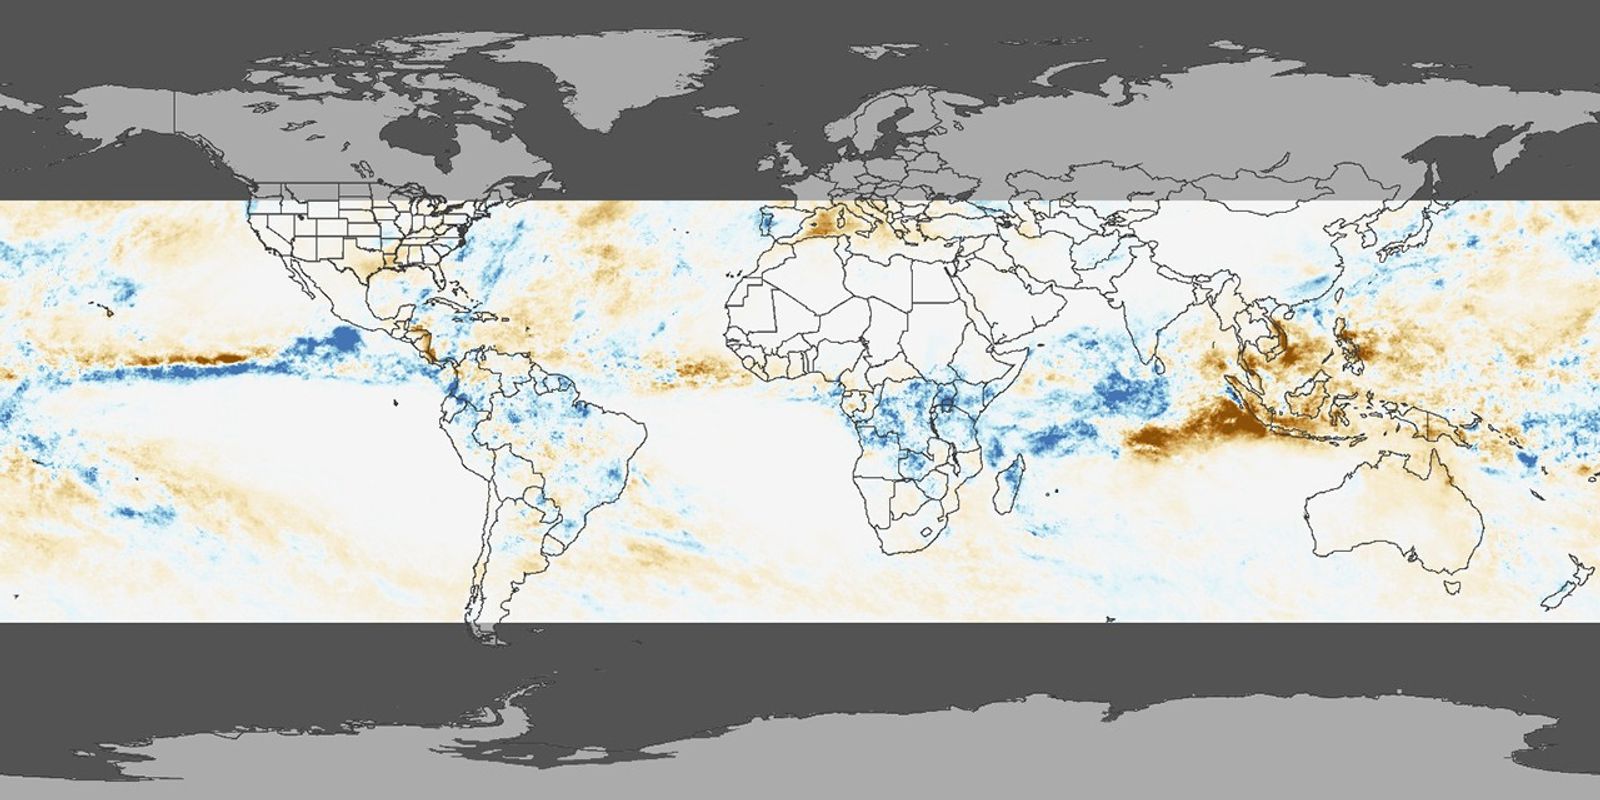
El Nino changes where tropical rainfall concentrates. Rainfall anomaly maps make the hazard pathway easier to understand than text alone.
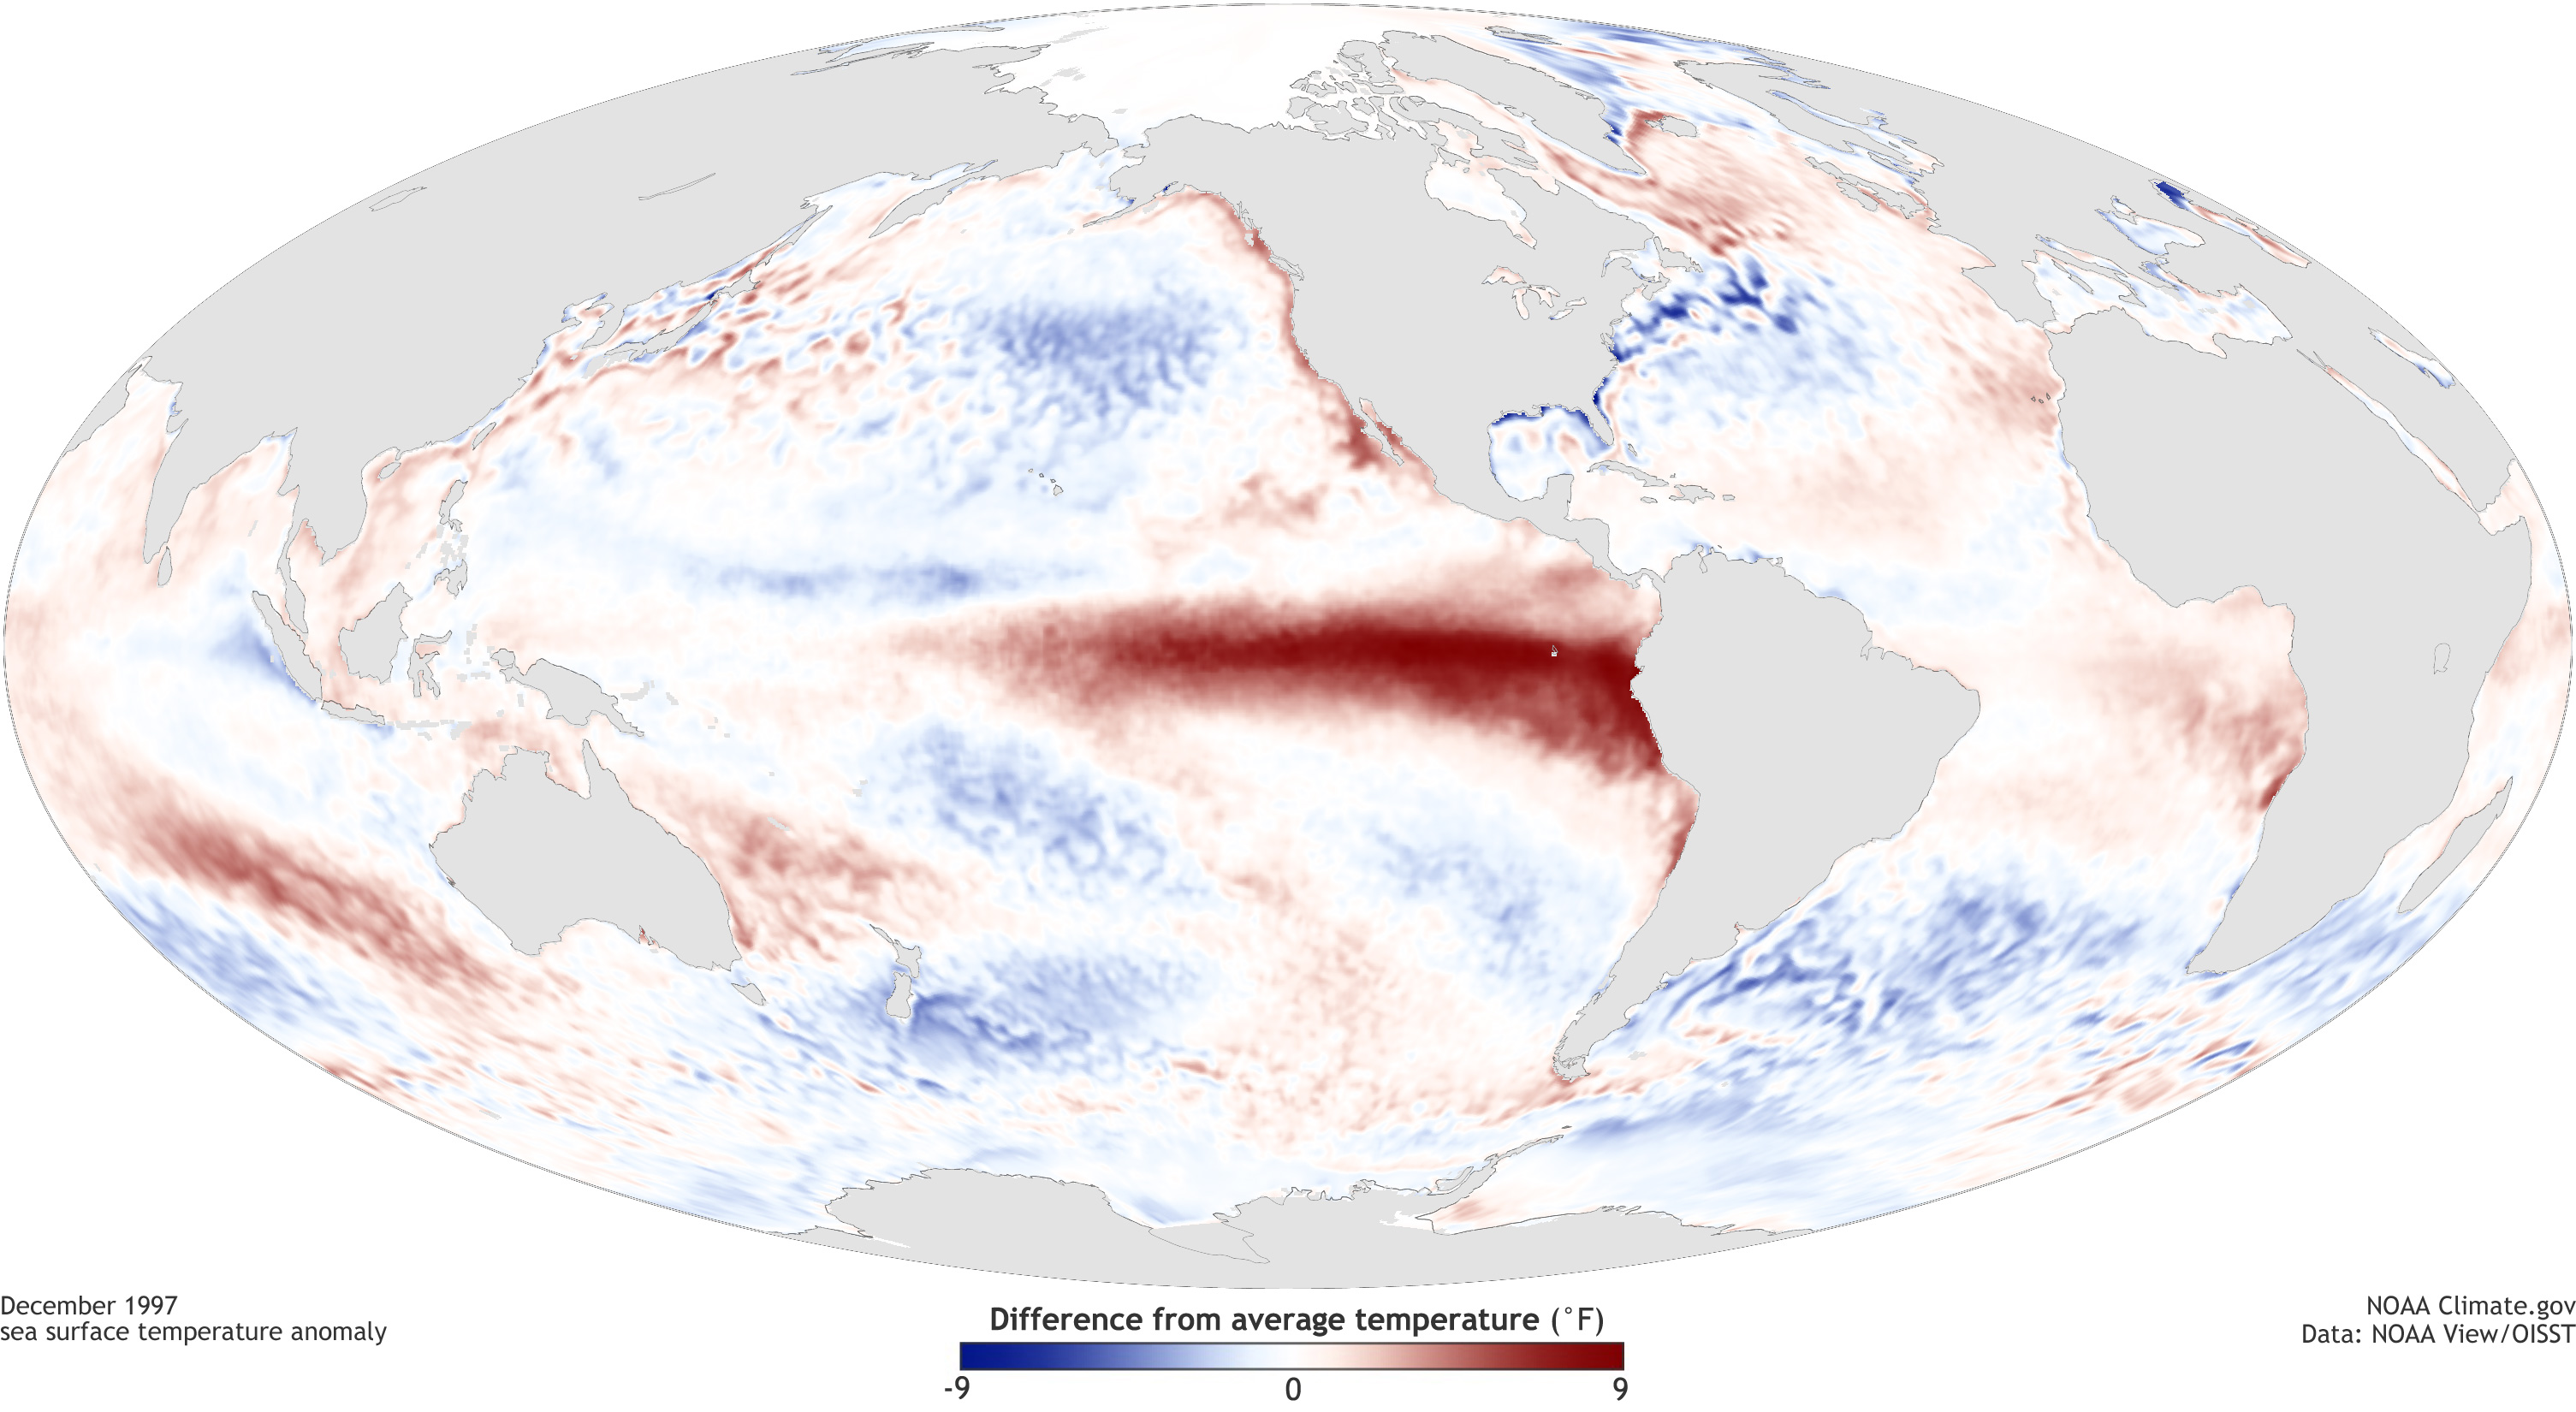
NOAA imagery of the 1997 El Nino shows why the tropical Pacific is the first place to watch before impacts appear on land.
Why El Nino 2026 deserves close attention
El Nino 2026 deserves close attention because the practical question is larger than a definition. Winter storms, home flood exposure, farm water stress, travel disruption, wildfire weather, coastal erosion, and local emergency planning can all shift when the Pacific signal changes. El Nino 2026 sits at the intersection of science and preparation: California households, South American growers, logistics teams, students, and local planners can all start with the same foundation, clear current signals from official data.
The most useful answer is not a single yes-or-no forecast. The useful answer is a live map. That is why this site starts with a globe. El Nino 2026 is global, so El Nino 2026 should be shown globally. El Nino starts in the tropical Pacific, but El Nino pressure often appears later as rainfall anomalies, marine heat, storm-track changes, drought, flood, crop loss, mudslide risk, reef stress, fisheries disruption, and heat waves. The globe makes the chain visible before the local consequences become expensive.
NOAA and WMO updates make the timing important. NOAA CPC probabilities published for 2026 show El Nino becoming the favored outcome by late spring and early summer, with the probability rising through fall and winter. WMO also described a weak La Nina fading toward ENSO-neutral conditions while El Nino chances rise later in 2026. That does not guarantee a severe El Nino 2026 event. It does mean El Nino 2026 is a live monitoring problem, not a static article.
El Nino 2026 also matters because the background climate is warmer than it was during older El Nino episodes. A warmer ocean and warmer atmosphere can change the baseline from which El Nino impacts unfold. The right way to explain El Nino 2026 is to separate the official ENSO label from the live ocean surface, then connect the ocean surface to regional risk. That is the monitoring job of elnino2026.com.
What El Nino has done before
History is the reason El Nino 2026 deserves a dedicated tracker. The 1982-83 and 1997-98 El Nino events are remembered in California for coastal flooding, erosion, landslides, road closures, structural damage, and major public response. The California Coastal Commission notes that the 1997-98 El Nino brought 17 storm-related deaths in California and red-tagged homes in the coastal zone. The same source lists hundreds of millions of dollars in statewide and coastal-resource damage for major historical El Nino winters.
The 2015-16 El Nino showed why El Nino is a humanitarian issue, not only a weather story. WHO reported that El Nino 2015-2016 affected more than 60 million people, with drought, food insecurity, flooding, disease risk, malnutrition, heat stress, and respiratory disease. WHO also cited a US$3.6 billion humanitarian response requirement, including nearly US$460 million for health-sector requirements. FAO reported severe crop and livestock impacts, millions of food-insecure people in southern Africa, drought in Central America, and major agricultural losses in Asia and the Pacific.
That history explains why El Nino 2026 should be watched before damage begins. El Nino 2026 can push families, communities, and businesses toward practical decisions: clearing drainage, buying flood barriers, preparing generators, checking roof and gutter systems, monitoring mold, comparing insurance deductibles, planning reservoir operations, hedging crop exposure, and preparing emergency stock. The risk can feel far away until someone asks, “What does El Nino mean for my place?”
elnino2026.com answers that question by making El Nino 2026 visible first and local second. The first release is free: anyone can load the globe, see the live ocean layer, read the current indices, and understand whether El Nino 2026 is moving closer to an official warm-phase event. The goal is to help people notice the signal early, understand the uncertainty, and prepare with more context.
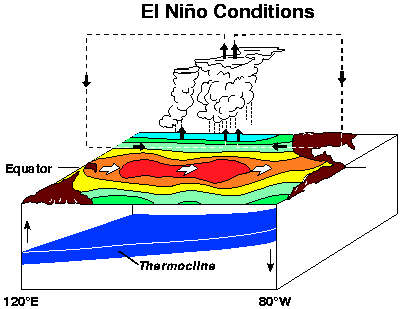
NOAA PMEL schematic: weakened trade winds allow warm water to spread eastward across the equatorial Pacific.
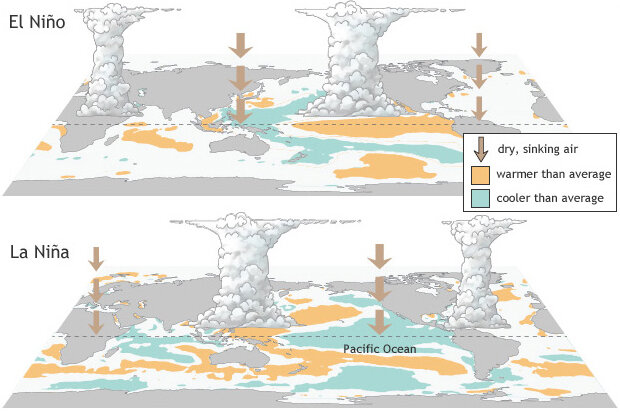
NOAA explainer graphic: El Nino is an ocean-atmosphere pattern, not simply hot weather or a single storm.
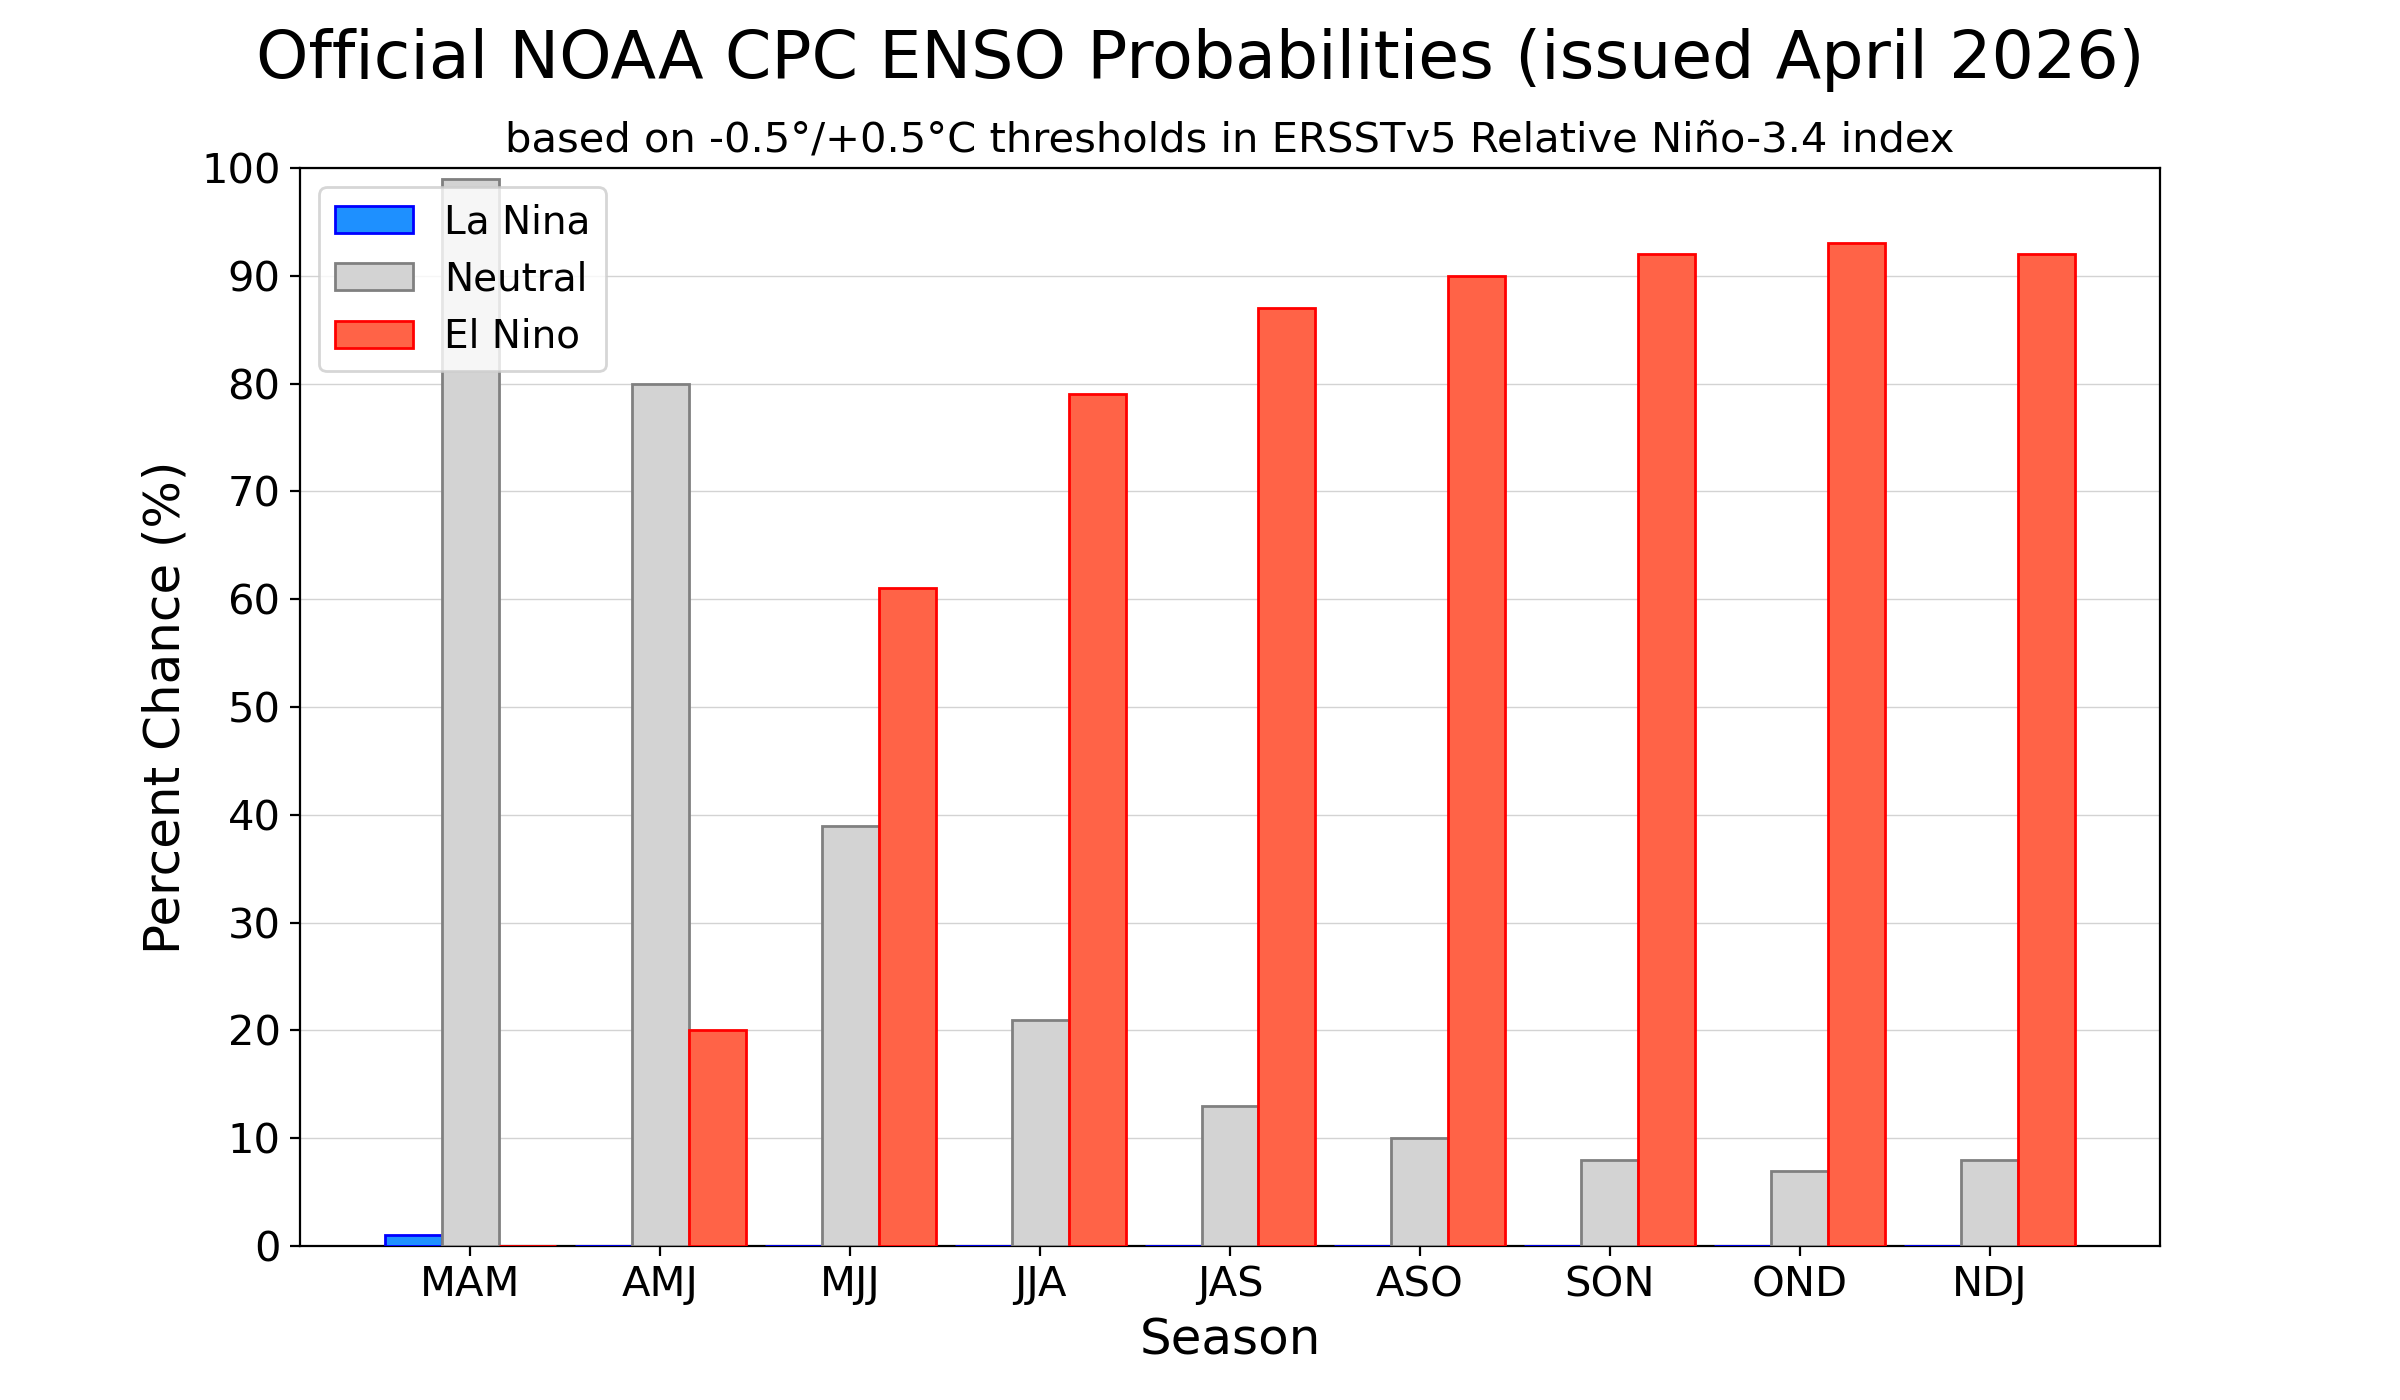
NOAA CPC probabilities show why El Nino 2026 deserves live monitoring through the second half of 2026.
What this El Nino 2026 globe shows for free
El Nino 2026 starts with NOAA OISST sea-surface temperature anomaly data. The current free globe uses an OISST anomaly texture to show where the ocean is warmer or cooler than normal. El Nino appears first as ocean structure, not as a headline.
El Nino 2026 status is summarized with Niño 3.4, ONI, and RONI. Niño 3.4 tracks the central equatorial Pacific. ONI is the classic three-month measure. RONI adjusts the lens for a warmer world, which NOAA says can better represent some U.S. precipitation impacts.
El Nino 2026 is also watched through TAO buoy readings in the equatorial Pacific. The current globe plots live Pacific observation points, connecting El Nino surface texture with real measurement locations.
El Nino 2026 is clearer with this mix because a single index can be misleading. El Nino may be declared only after ocean and atmosphere criteria persist, but the build-up can be monitored before the official label arrives. This site therefore treats El Nino 2026 as a monitoring stack: OISST for the surface, Niño 3.4 for the core region, ONI for the historical climate label, RONI for a relative modern baseline, and TAO buoys for direct Pacific observations.
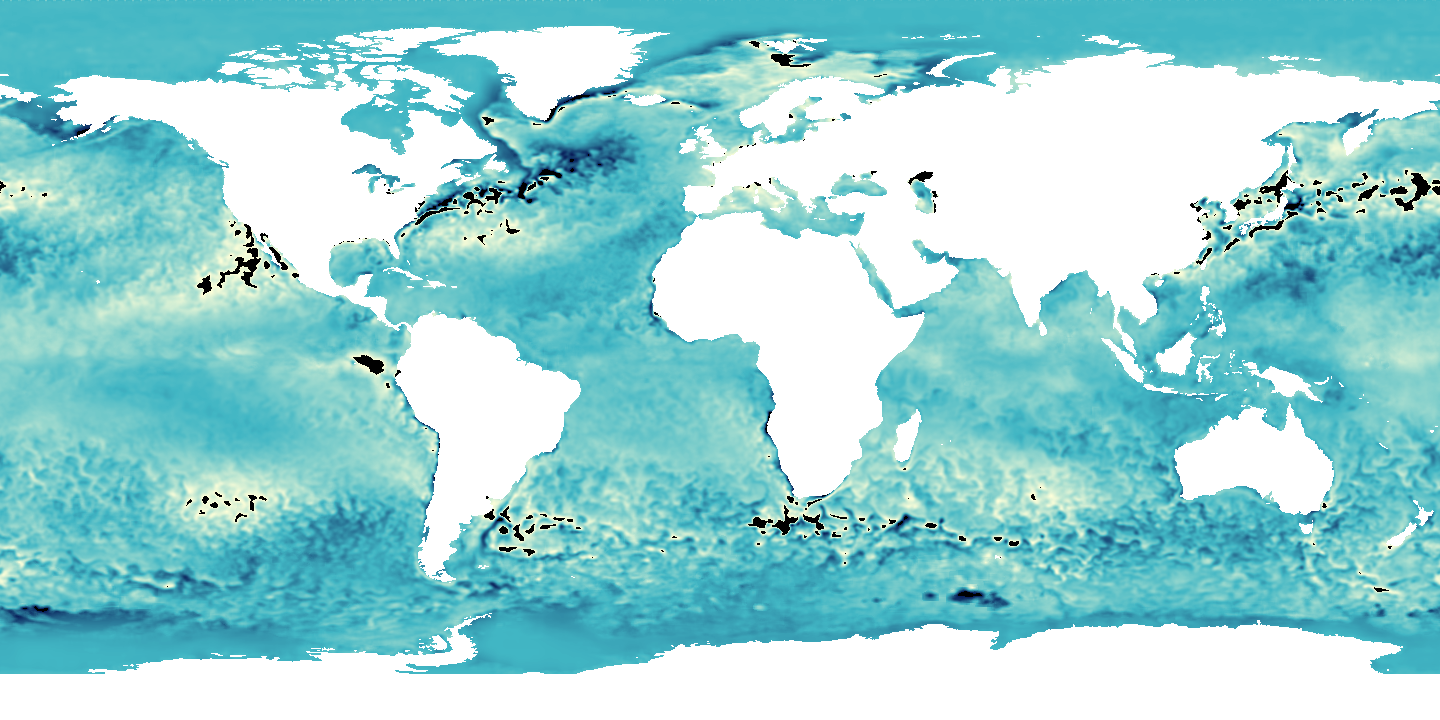
The current globe layer is generated from NOAA OISST anomaly imagery and placed on the rotating Earth.
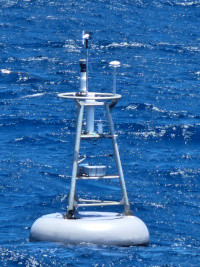
TAO buoys measure the equatorial Pacific directly, placing real observation points behind the El Nino 2026 visual layer.
The site pairs live ocean texture with official probability context so El Nino 2026 is tracked as a changing signal.
El Nino 2026 questions are preparation questions.
El Nino 2026 forecast, El Nino 2026 California, El Nino 2026 weather, El Nino 2026 flooding, El Nino 2026 storm season, El Nino 2026 drought, El Nino 2026 crops, El Nino 2026 insurance, El Nino 2026 sea surface temperature, El Nino 2026 NOAA, El Nino 2026 live map, El Nino 2026 tracker, and El Nino 2026 prediction all point to the same question: what is the live signal, what is the local interpretation, and what practical action comes next. That is why El Nino 2026 belongs on a globe first, then inside location pages, alerts, and plain-language monitoring notes.
Why weekly checks help
El Nino 2026 is not a one-day event. El Nino 2026 develops, stalls, strengthens, weakens, or shifts as the ocean and atmosphere couple. Someone who checks El Nino 2026 once learns the definition. Someone who checks El Nino 2026 every week sees the signal mature, stall, or fade. That cadence helps people separate a noisy headline from a changing climate signal.
California is watched closely because historical El Nino winters have made coastal hazards concrete: waves, erosion, landslides, debris flows, road closures, structural damage, and emergency claims. El Nino 2026 does not guarantee those outcomes, but it can change the background conditions that homeowners, communities, and planners should follow.
El Nino 2026 can also be translated into local context using public weather, flood, wildfire, precipitation, soil moisture, and drought datasets. The practical question is simple: what changed near my home, farm, school, road, or facility this week as the El Nino signal changed?
Property managers, farm operators, logistics teams, insurers, and local officials are not served by a generic El Nino definition alone. An El Nino 2026 watchlist should turn open climate data into places to watch, thresholds to review, and weekly actions to consider.
This NOAA video explains how El Nino changes Pacific winds, warm water, and global weather connections. It is included here because El Nino 2026 is best understood with both live data and plain language.
Frequently asked El Nino 2026 questions
Is El Nino 2026 confirmed?
No. El Nino 2026 is a developing watch, not a guaranteed official event. NOAA CPC probabilities rise through 2026, but spring forecasts face a known predictability barrier. The site tracks El Nino 2026 as a live signal so the build-up is visible before any formal declaration.
What is the most important El Nino indicator?
The best first indicator is sea-surface temperature anomaly in the tropical Pacific, especially the Niño 3.4 region. For El Nino 2026, this site combines OISST surface anomaly, Niño 3.4, ONI, RONI, and TAO buoy observations because El Nino is both an ocean pattern and an atmosphere-ocean feedback loop.
Why is California emphasized?
California is emphasized because historical El Nino winters have produced coastal erosion, flooding, landslides, debris-flow exposure, infrastructure damage, and insurance questions. El Nino does not guarantee those outcomes, but it changes the context that homeowners and planners watch.
What makes this site different from a normal forecast article?
A normal article explains El Nino once. elnino2026.com turns El Nino 2026 into a recurring monitoring surface. The free layer shows live ocean anomaly data, ENSO indices, and Pacific observation points so people can follow the signal as it changes.